Google’s Performance Metrics: What They Really Mean
At Cause Inspired Media, we spend most of our days examining various Google Grant accounts for our clients. If you are currently one of our clients, you have likely noticed the monthly Google Analytics reports we send out via email. These reports contain statistics regarding the performance of your various campaigns each month.
If you work with Google AdWords software, or are a client of ours, you have probably seen or heard of these terms. Here is a breakdown of the main performance metrics that we use in our reporting for Google Analytics. We’ll explain what these metrics mean in Google’s terms, and then follow with a real-world description.
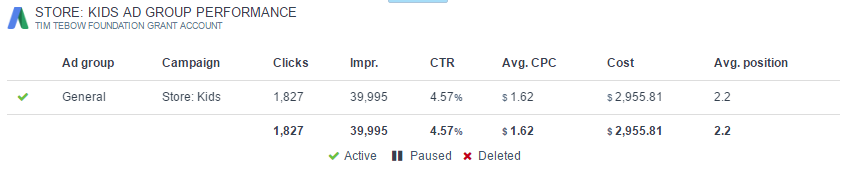
Clicks:
- Google’s Definition: The number of times a user clicks on your ad.
- Real-World Comparison: This one is actually pretty self explanatory. Each time someone clicks on your ad, Google counts it as a “click,” and uses this metric when determining other performance metrics, such as your CTR, and CPC.
Impressions:
- Google’s Definition: The number of times your ad is displayed. An impression is counted each time your ad is shown on a search result page.
- Real-World Comparison: Think of impressions like a billboard. Lots of people are driving past it, but only a select few are actually going to pay attention and read every word of it. Your ads are the same way. Thousands of people are going to see your ads displayed, but only a small percentage are actually going to click on your ad to go to your website.
- Don’t let the phrase “small percentage” mislead you, though. A small percentage on tens of thousands of impressions is still a very large number of people visiting your website.
- See “click-through-rate” below for more details.
Click-Through Rate (CTR):
- Google’s Definition: The number of times people click your ad in comparison to the number of times users are exposed to that item. CTR is the number of clicks your ad receives divided by the number of times your ad is shown: Clicks ÷ Impressions = CTR
- Real-World Comparison: This metric is among the most important mentioned here. Having a high click-through-rate is indicative of a highly relevant ad, and would therefore have higher rates of engagement. A high click-through-rate demonstrates that a high percentage of people who see your ad are actually clicking on it, and spending time on your website. This means that the ad is relevant to what they searched, and it clearly and effectively communicates your organization’s message.
- Google considers anything above 1% to be a good click-through-rate.
- With the Google Grant, we aim to achieve the highest click-through-rate we can for our clients. Our goal is to send as much relevant traffic to your website by creating ads that are compelling, engaging, and relevant to the search performed, in order to obtain the highest CTR as possible.
Average Cost Per Click (Avg. CPC):
- Google’s Definition: The average amount that you’ve been charged for a click on your ad. Average cost-per-click (avg. CPC) is calculated by dividing the total cost of your clicks by the total number of clicks.
- Real-World Comparison: Like “clicks,” this one is fairly self-explanatory as well. This metric refers to the actual price you pay for each click your ads receive.
Cost:
- Google’s Definition: Total ad spend amount.
- Real-World Comparison: Think of this as the cost for advertising on any particular medium, whether it be a radio ad, a printed banner, or a billboard.
- With the Google Grant, our goal for our clients is to spend as much of their $10,000 monthly allotted ad spend as possible, through weekly optimizations. The grant gives 501(c)(3) nonprofit organizations a $120,000 yearly credit to advertise using Google AdWords software. Our goal is to use our clients ad spend to get as much valuable traffic to their sites as possible.
Average Position:
- Google’s Definition: A statistic that describes how your ad typically ranks against other ads. This rank determines in which order ads appear on the page. The highest position is “1,” and there is no “bottom” position. For example, an average position of 1.7 means that your ad usually appears in positions 1 or 2.
- Real-World Comparison: A good way of thinking about this is to compare it to an ad in a newspaper or magazine: Is your ad where someone is going to pay attention to it? Or is it tucked away toward the back? An average position that is close to 1 is indicative of a highly relevant ad, and a high quality score.The higher (or closer to 1) your ad ranks, the more people are likely to click on your ad.
- With the Google Grant, we use best practices to ensure that your average position is as close to 1 as possible.
If you are interested in having Cause Inspired Media obtain and/or manage a $10,000 monthly Google Grant for your nonprofit, contact us! We’re happy to help!
By: Emily Dietz, Business Development Strategist